Metrics
By default, controller-runtime builds a global prometheus registry and publishes a collection of performance metrics for each controller.
Protecting the Metrics
These metrics are protected by kube-auth-proxy
by default if using kubebuilder. Kubebuilder v2.2.0+ scaffold a clusterrole which
can be found at config/rbac/auth_proxy_client_clusterrole.yaml.
You will need to grant permissions to your Prometheus server so that it can
scrape the protected metrics. To achieve that, you can create a
clusterRoleBinding to bind the clusterRole to the service account that your
Prometheus server uses.
You can run the following kubectl command to create it. If using kubebuilder
<project-prefix> is the namePrefix field in config/default/kustomization.yaml.
kubectl create clusterrolebinding metrics --clusterrole=<project-prefix>-metrics-reader --serviceaccount=<namespace>:<service-account-name>
Exporting Metrics for Prometheus
Follow the steps below to export the metrics using the Prometheus Operator:
- Install Prometheus and Prometheus Operator. We recommend using kube-prometheus in production if you don’t have your own monitoring system. If you are just experimenting, you can only install Prometheus and Prometheus Operator.
- Uncomment the line
- ../prometheusin theconfig/default/kustomization.yaml. It creates theServiceMonitorresource which enables exporting the metrics.
# [PROMETHEUS] To enable prometheus monitor, uncomment all sections with 'PROMETHEUS'.
- ../prometheus
Note that, when you install your project in the cluster, it will create the
ServiceMonitor to export the metrics. To check the ServiceMonitor,
run kubectl get ServiceMonitor -n <project>-system. See an example:
$ kubectl get ServiceMonitor -n monitor-system
NAME                                         AGE
monitor-controller-manager-metrics-monitor   2m8s
Also, notice that the metrics are exported by default through port 8443. In this way,
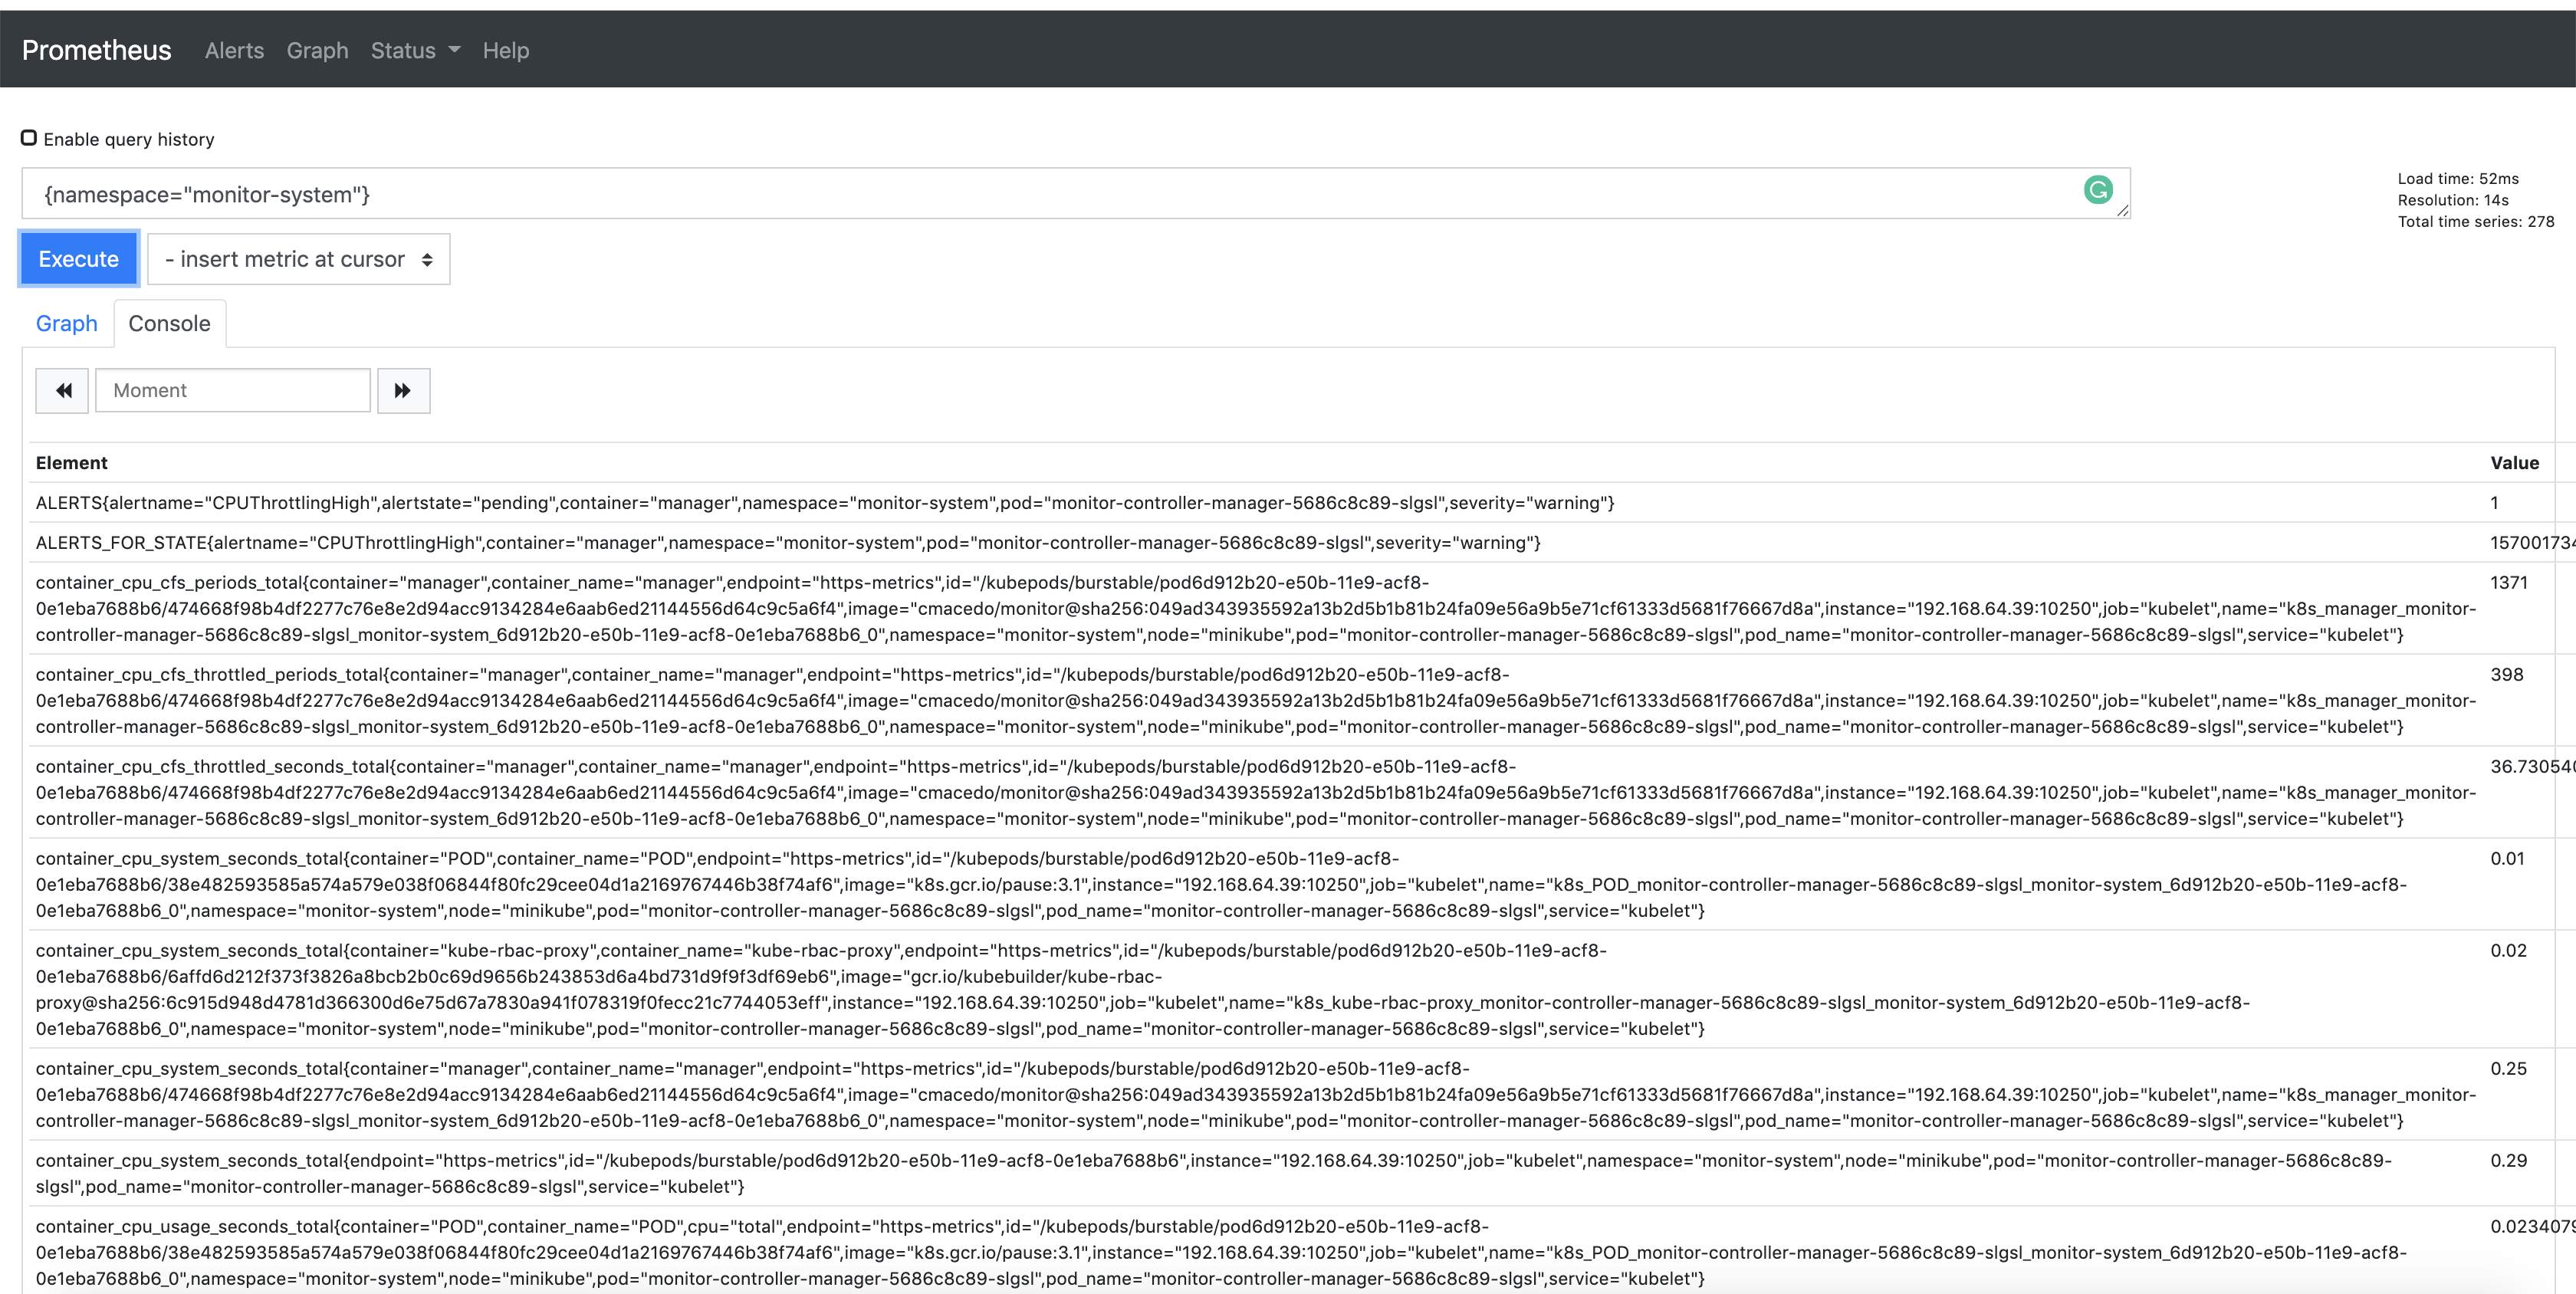
you are able to check the Prometheus metrics in its dashboard. To verify it, search
for the metrics exported from the namespace where the project is running
{namespace="<project>-system"}. See an example:

Publishing Additional Metrics
If you wish to publish additional metrics from your controllers, this
can be easily achieved by using the global registry from
controller-runtime/pkg/metrics.
One way to achieve this is to declare your collectors as global variables and then register them using init().
For example:
import (
    "github.com/prometheus/client_golang/prometheus"
    "sigs.k8s.io/controller-runtime/pkg/metrics"
)

var (
    goobers = prometheus.NewCounter(
        prometheus.CounterOpts{
            Name: "goobers_total",
            Help: "Number of goobers proccessed",
        },
    )
    gooberFailures = prometheus.NewCounter(
        prometheus.CounterOpts{
            Name: "goober_failures_total",
            Help: "Number of failed goobers",
        },
    )
)

func init() {
    // Register custom metrics with the global prometheus registry
    metrics.Registry.MustRegister(goobers, gooberFailures)
}
You may then record metrics to those collectors from any part of your reconcile loop, and those metrics will be available for prometheus or other openmetrics systems to scrape.
